Notes on FCW historical catch records

December 5th, 2011

These bulletin blogs represent news about Finavon and the South Esk, and my views as a riparian owner. They are not the views of any other organisation, nor are they designed to promote the interests of any individual or organisation other than Finavon Castle Water and factors affecting the fishery.  Tony Andrews

The South Esk must be one of the most badly treated Scottish east coast rivers. Similar to the lethal pollution meted out to the Aberdeenshire Don from paper mills, the South Esk suffered long term damage from badly constructed and maintained dams, over exploitation by nets, Brechin sewage & paper mill pollution, and a general disregard for one of our most productive small rivers. It just surprises me that the river has stocks of both salmon and sea trout as healthy as they are today. But the river’s fortunes are changing…

The South Esk is benefitting enormously from its SAC status. Money has been spent on improving habitats for spawning and juvenile fish in the upper catchment and tributaries. As a priority catchment for dealing with diffuse pollution from agriculture, SEPA is developing a model regime of controls and incentives for farmers. The South Esk Catchment Management Partnership is raising public awareness of the importance economically and socially of The South Esk to Angus. In addition to these external influences on the river’s wellbeing the Esk Rivers Trust has done some sterling work to eradicate giant hogweed and Japanese knotweed, as well as some innovative and important habitat improvement work in Glen Clova, especially the planned Rottal Burn restoration project. But the trust is strapped for cash while the Esk Fishery Board is sitting on cash reserves of over £300,000. It would seem that the board does not view its capital assets as the rivers for which it is responsible. Quite why the board has such large reserves at a time when the rivers, not least the South Esk, need investment, is beyond my understanding (George Pullar doesn’t want to sell his netting rights, so forget that). If there is a ‘rainy day’ they are waiting for, perhaps someone could explain what that rainy day is! It could therefore be argued that in terms of freshwater and terrestrial management the South Esk is in a better place than it has ever been, but it could be a lot better if the Esk Trust had more resources to build on its successes.

The two major problems that affect the numbers and quality of returning salmon and sea trout are high mortality at sea and the unknown impact of mixed stocks exploitation. Only one of these is under our direct control, but one thing is absolutely clear – that we must continue to improve the conditions in the river and its tributaries to enable the maximum number of naturally generated smolts to leave the river in the spring of each year. At the end of the day the river is a natural ‘smolt factory’ and the success of our management of the freshwater environment can be measured by the numbers of smolts produced by the river. We should be measuring this output.

During the years of relative abundance we could expect between 25% and 30% of our smolts to return to the river as adult fish. In the 1960s and 1970s there was also a number (details unknown) of ‘second-returners’. These reconditioned kelts returned to the sea and recovered sufficiently to return to spawn for a second time. Most of these second returners were female and were therefore important ‘egg carriers’. Nowadays we expect to see only the very occasional second returner. It is interesting to note that in Canadian rivers, especially the Mirimashi, the return rate of spawned fish is very high. On my recent visit to Canada the river Mirimashi biologist told me that the return rate was thought to be “about 30%”. An interesting aspect of the Canadian post kelts is that they wait in the Bay of Fundy for the outgoing smolt migration before heading off north into the Labrador Sea. Biologists are speculating that these older fish may be showing the post-smolts the way to the feeding grounds – effectively ‘shepherding’ them along the migratory route!

A quote from the Menzies report of 1957 explains a key feature & influence on S Esk spring runs, “The dykes are of oldstone construction, but if any are fronted & coated with cement the obstruction to fish is increased very greatly and what was formerly comparatively harmless may have become very serious. Watch should be kept for repairs”. (Menzies 1957). I will publish the Menzies report in this bulletin soon.

The relationship of FCW spring catches to numbers of spring salmon caught at Upper Kinnaird, which is the double bank beat from the Kinnaird Dyke down to the Boat Pool – a total distance of about 1500 yards, tells the real story of why the South Esk has not returned stronger spring salmon catches from the middle and upper river. If you look at the period from 1977 to 1990 you will see that Upper Kinnaird was consistently giving returns of 200+ salmon, the bulk of which were caught before the middle of May. During the same period Finavon’s spring catches were lacklustre – to say the least. Since 1998 the Kinnaird Dyke has been much improved, thanks to a simple but highly effective adjustment by Colin Carnie. The situation today is that spring salmon disperse throughout the middle river in March. I would not be a bit surprised in the next few years to see the occasional early salmon caught at Finavon in February.

A note on netting (by CB): “Net & coble were worked to the foot of Brechin Papermill Dyke. 16 nets fished 5 miles of river below Brechin until 1897 when all nets were removed from fresh water. There were two other dykes below below Brechin, East Mill & Balbirnie” (Calderwood). The Brechin Papermill Dyke was removed in 1935 (Grimble’s salmon rivers of Scotland 1913 has a good picture of this dyke on page 134). Other references **”Vicissitudes of an Angus river “by AG Chalmers (Eskmount Finavon II 1935). Excerpt from Country Life 22/4/1965 and W Jamieson R.South Esk Kinnaird Castle F III 21.

**I will publish “Vicissitudes of an Angus River” in this bulletin soon.

Some idea of the potential of the South Esk can be seen in the 111 years of records, especially in wet years (when coastal netting is less effective) or in years of great abundance. But there isn’t much doubt that the obstructions within the river (thankfully mostly now removed except for Kinnaird Dyke) have been a major cause of preventing salmon and sea trout getting up into the upper river to spawn. It really is amazing that stocks have held up so well, but imagine what it could be like if the river had been better managed….

Best years for spring salmon at Finavon: 1925: 64, 1947: 36: 1940: 35, 1945: 34, 2006 & 2011: 33, 1941: 32. Cyril Butler (CB) wrote, “April ’39, ’40, ’41, ’47 very good fishing. ’50, ’51, ’52, ’53 very poor. Salmon recover in ’54. Thereafter getting steadily worse though fishing in May improving until 1967 (UDN)”

Worst years at Finavon

1918, 1929, 1933, 1984: No Spring fish

1902, 06, 07, 12, 46, 51, 68, 71, 75, 85: one fish only

Averages of recorded spring salmon catches at Finavon over 111 years

Average spring 1900 to 2011 = 11.76 salmon

Average 1900 to 1925 = 9.69 salmon (26 years)

Average 1926 to 1956 = 15.35 salmon (31 years)

Average 1957 to 1987 = 9.03 salmon (29 years)

Average 1988 to 2011 = 12.24 salmon (21 years)

Average 2006 to 2011= 21.0 salmon (6 years)

A point of interest: During the six years 2006 to 2011 Inshewan’s spring catches were 29, 8, 28, 15, 6 & 28 giving an average of 19 spring salmon (Inshewan is 5 miles upstream of Finavon)

1. It was a considerable surprise to learn that the last 6 years have shown the best spring salmon catches at Finavon since the 1940s .

2. These improved catches may well be connected with the end of coastal netting south of the river’s estuary in February, March and April since 2006, and therefore probably reflect increased escapement rather than higher recruitment (which takes a minimum of 5 years for MSW fish)

3. There is also a benefit to middle river beats, of which FCW is one, from the improved Kinnaird fish pass. This is because migrating adult fish can now traverse the pass in nearly all water levels and temperatures, thanks to Colin Carnie’s subtle bu effective alteration in 1998..

4. In future blogs I will return to both of these points, but the one I want to make now is that remnants of the spring salmon run are still present and, where water levels and temperatures allow, spring salmon are being caught, despite the relatively low rod effort (about which more in a later blog).

5. While I will make no claim that all is well with the spring contingents of the South Esk’s salmon stock, I will say that the pessimistic statements made by some people are not consistent with the data provided by Finavon’s catches, although these stats only give a snapshot, not the complete picture.

6. I still have some double checking to complete on some of the above catch figures, but they are fairly accurate as they stand. The only year absent is 1984 when there were no records made.

It is important that we recognise that coastal netting and in-river netting have declined massively over the years. The Esk District has one of a small number of mixed stocks netting operations that still exist. It is worth noting that the Usan nets are particularly effective in killing large numbers of South Esk bound salmon, perhaps as many as 3,000 in a season. The fact that these nets do not operate in the first two and a half months of the season does allow early running fish free access to the River. Were these nets still operating during that early season period I am confident that our spring catches would be considerably less. But, in my opinion, the biggest influence on rod catches, certainly above Brechin, has been the numerous dams in the river. More on this in future blogs.

TA
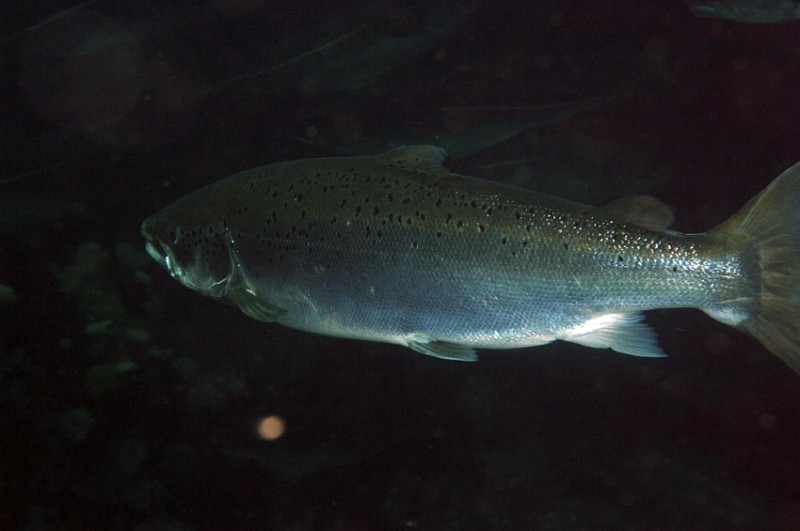


Spring salmon catches over 111 years at Finavon

November 27th, 2011

These bulletin blogs represent news about Finavon and the South Esk, and my views as a riparian owner. They are not the views of any other organisation, nor are they designed to promote the interests of any individual or organisation other than Finavon Castle Water and factors affecting the fishery.  Tony Andrews

The table below shows salmon catches at Finavon between 1900 and 2011 in the months of February, March, April & May. I have also included some notes on exploitation effort, comparative catches from other beats, alterations to fish passes & other variables

Sources: Finavon Estate records & records from other South Esk fishings.

Year Feb March April May Total COMMENTS from Cyril Butler’s notes 1895 to 2000. Tenant FCW for 50 years. Also other beats & whole river catches.
1900 3 1 4  Inshewan season 16xS & 18xST
01 1 1 2 4  Inshewan 3xS & 5xST
02 1 3 4  Inshewan 13xS & 16xST
03 1 Many  salmon in Oct & Nov 03 at FCW Inshewan 26xS & 22xST
04 1 1 1 3
05 3 3 6
06 1 1 2
07 1 1
08 1 1
09 6 1 7
10 1 1 2
11 5 2 7
12 1 1
13 3 9 12
14 3 1 1 5
15 1 4 1 6
16 2 1 3
17 1 1 2
18
19 9 1 10 Driest year since 1868
20 13 7 10 30
21 10 3 13
22 8 8 Proprietor above Brechin wrote, “1922 bag spring salmon 4. River in 1st class order but 220 salmon killed by Kinnaird rods & over 600 netted at Brechin dyke” (CB)
23 4 15 7 26 Brechin river netting ended but only after the same proprietor (see 1922) wrote “5 fish in spring. River in beautiful condition but Brechin nets stopped all the fish” (CB)
24 20 10 30
1925 11 33 20 64 Best spring year recorded at FCW but CB thought kelts were counted too. “Kinnaird Dyke greatly improved. Nearly 400 salmon taken above Brechin” (CB)
26 1 2 3 4 9 19lbs fish caught on 20/2 .”Spring run has been increasing since 1895″ (CB)
27 12 14 1 27 “low effort. 250 salmon & 377 ST above Brechin” (CB)
28 12 10 22 New dam built at Persie on Prosen (Menzies comments in report of 1957)
29 “About 130 salmon & 346 ST. Only 21 salmon killed in spring. Inshewan returned 110 ST. Salmon 30lbs & 35lbs killed at Shielhill”. (CB)
30 7 9 16 “autumn run comes in mid Nov. 69 in spring. 35 grilse. 170 autumn. 843 sea trout” (CB)
31 11 25 36 Sir Kirkman Finlay lease to 1935. Aldbar Estate sold (Kintrockat) “398 spring fish in whole river, including Kinnaird. 719 sea trout” (CB)
32 6 12 9 27 “805 dead fish removed from river to end of Feb. Little fungus but some furunculosis. All S Esk cattches: Spring salmon 349, summer & autumn 237. Grilse 10. ST 648.” (CB)
33 7 7 “128 spring salmon caught below Brechin. Very dry season. Poorest fishing in memory. spring 128. 6 grilse. 78 autumn & 411 ST” (CB)
34 6 3 4 13 “Improvement on 1933 but fish ct above Brechin disappointing. 324 spring fish (234 below Brechin & 90 above) 23 grilse. 187 summer. 611 ST.” (CB)
35 6 6 5 17 “Brechin Paper Mill Dam breached in late autumn by agreement. 399 spring(256 below Brechin: 143 above) 11 grilse. 253 summer. 461 ST.” (CB)
36 1 2 3 “ADG-G & Mr John Ogilvy inspected Kinnaird Dyke and saw large numbers of fish, many diseased. Approach to pass too shallow. Repairs recommended & executed. Whole river: 239 spring (212 below Brechin). 9 grilse. 120 S&A salmon. 517 ST.” (CB)
37 1 7 4 12 “Exceptional flood in mid January damaged Kinnaird Dyke. ” (CB)
38 1 3 4 Duke of Wellington tenancy at FCW starts. “486 spring (349 below Brechin). No grilse. 214 S&A. (121 above Brechin). 537 ST.” (CB)
39 8 18 3 29 “Southesk Estates complain about damage to Kinnaird dyke. 209 spring (121 below Brechin). 22 grilse. 158 S&A. 1089 ST.” (CB)
40 1 20 14 35 “Major Chalmers (Aldbar & Kintrockat) tried unsuccessfully to buy Mill Dyke & fishings from Lord S Esk. Springers 201 (86 below Brechin – a v. poor year) grilse 13. S&A 174. 1068 ST.” (CB)
41 17 15 32 “Mr Walker Craigeassie started to raise height of dyke. Fishery Board negotiated a gap designed by Mr Menzies in summer 1940” (CB)
42 6 12 18 Low effort. I think Terence Horsley was a tenant at FCW in 1941/42.
43 6 6
44 1 6 2 9 “River pollution case. Calderwood put damage at £1500 salmon alone”. (CB)
45 13 9 12 34 Rubble dyke at Tannadice breached
46 1 1
47 12 24 36 Malloch & Macfarlane report on Kinnbaird dyke improvements completed” (CB)
48 1 8 6 15
49 3 10 1 14 Malloch & Macfarlane plan
50 2 5 8 15
1951 1 1
52 1 5 7 13 The first year of consolidated Scottish salmon & sea trout catches.
53 1 3 4 Low effort (one rod only)
54 13 10 6 29
55 4 5 9 Repairs to Kinnaird fish pass. Kinnaird in-river nets terminated from 1 Dec 1955 (CB)
56
57 7 8 15
58 3 11 14
59 9 12 21
60 8 12 20
61 10 7 17
62 4 10 14
63 1 9 10
64 4 24 28
65 2 7 9
66 6 21 27
67 3 5 8 Kinnaird fish pass altered. UDN
68 1 1 UDN
69 1 4 5
70 1 2 3 New Kinnaird pass built. 24lbs April salmon (Cyril Butler Tyndals)
71 1 1
72 3 2 5
73 2 2
74 1 1 2
75 1 1
76 3 1 4
1977 4 12 16  Upper Kinnaird (just below the infamous dyke) 469 salmon
78 3 3 6  Upper Kinnaird 915 salmon
79 3 3  Upper Kinnaird 369 salmon
80 3 5 8  Upper Kinnaird 897 salmon
81 5 1 6  Upper Kinnaird 190 salmon
82 2 2  Upper Kinnaird 176 salmon
83 2 2 Upper Kinnaird 317 salmon
84 Upper Kinnaird 353 salmon
85 1 1 AA/MS ownership begins at FCW. Upper Kinnaird 382 salmon
86 11 11 Fishing effort low FCW. Upper Kinnaird 453 salmon
87 1 2 3 Still low effort at FCW. Upper Kinnaird 294 salmon
88  Upper Kinnaird 253 salmon
89  Upper Kinnaird 200 salmon
90 1 2 5 8 1XFeb fish caught by APHA at FCW. Upper Kinnaird 261
91 1 2 3  Upper Kinnaird 283 salmon
92 1 6 3 10  Upper Kinnaird 336 salmon
93 1 2 6 9  Upper Kinnaird 204 salmon
94 1 5 2 8 MS/AA ownership ends. Upper Kinnaird 199 salmon. In the years 1977 to 1994 the average number of salmon killed in the 750 yards of the Upper Kinnaird beat was 339. Most of these fish were caught before the end of May. In the same years few salmon gained access to the river upstream of Brechin before mid April. The reason was of course the temperature barrier of the dyke itself. (This has now been improved) (TA)
95 1 3 4 Montrose Basin netting ends
96 1 5 19 25
97 2 1 3 6
98 5 10 15 Kinnaird fish pass altered (Carnie)
99
2000 4 3 7
01 5 5 10
02 1 3 1 5
2003 1 1 2
04 2 5 6 13 Montrose Bay nets bought out by monies raised from Esk District levies and other sources
05 3 3 2 8  Boddin nets sold to Pullar family by Martin stansfeld for £100,000
06 1 7 19 6 33 Feb fish verified. Low effort
07 1 6 1 5 13 Low effort
08 3 6 2 11 Kintrockat Dam breached. Low effort. Excellent autumn fishing this year (FCW 220 S & G)
09 8 13 21 Two big fish (well into the 20s of lbs) seen from Haughs Aqueduct. Low effort because of low water.
10 12 1 13 May very low water. Potentially a good spring run, ruined by low water. Hence Low effort in the late spring.
11 8 7 18 33 Prolific spring salmon run. Effort up. Colin Gibb at Inshewan commented “the best spring run since the 1960s”. Usan nets did well too. Large numbers of fish, many diseased, seen in Sawmill Dam Pool in late April.

It is important to appreciate that fishing effort varied enormously during these 111 years. There are clues occasionally which have enabled me to assess effort. For example, between 1935 and 1940 there was a local syndicate during the sea trout season. I have spoken to the families of some of those Forfar shop owners and traders, from which it became clear that members of that syndicate were regulars and their skill level was high. The catches reflect that. On the other hand, particularly in the early years of the twentieth century, effort was desultory and sometimes non existent. I suspect that, during the years when the spring catch dominated the returns, noone really bothered to fish after about mid June, and sea trout were simply not valued.

One of the jobs on my ‘to do’ list is to try to devise a method of measuring effort, somehow incorporating skill and local knowledge as important factors in measuring the effectiveness of the effort made. For example, if it is Derek Strachan or Moray Macfarlane fishing for spring salmon in late March they will know where these early running fish are likely to be in the cold strong flows of emerging spring. That knowledge means that one hour spent on the river by an experienced local rod probably is the equivalent of 2 or 3 hours of someone new to the river.

TA

Finavon Castle Water. Putting the 2011 season in context.

November 20th, 2011

These bulletin blogs represent news about Finavon and the South Esk, and my views as a riparian owner. They are not the views of any other organisation, nor are they designed to promote the interests of any individual or organisation other than Finavon Castle Water and factors affecting the fishery.  Tony Andrews

Finavon Castle Water, River South Esk

Anyone talking about salmon these days simply has to take account of their unprecedented collapse in survival at sea before they start counting what they have caught in their wee patch. The truth is, and I cannot escape saying it, is that there are not enough salmon returning to our rivers to justify continuing to kill them as we did in the past. With that in mind anything that follows in these blogs about the performance of 2.4 miles of the middle South Esk during 2011 must be seen in the context of the overall decline in numbers of fish.

A March salmon of 15lbs (below)  from the Willows on Milton Beat. Spring fish like this one are the ultimate quarry of the salmon fly fisherman.

Playing a 15lbs salmon in Indies Pool

Nearing the end: a 15lbs spring salmon

In these out-of-season blogs I have attempted to show the local constraints to good numbers of salmon (and sea trout) accessing the river. The unpalatable fact is that the river is probably producing as many smolts as it did thirty years ago. There was far more exploitation by the nets then, and many more obstacles in the river. Finavon’s catches should therefore be seen as rods exploiting the remnants of far greater numbers of fish. The fact is that we are all catching fish from a diminishing stock of survivors, as are the coastal nets. 95% of our smolts are destined to die at sea. Multi sea winter salmon that feed in the Irminger Sea or off the Greenland coast are doing quite well, but those thin grilse – Belsen grilse – are scraping by on a meagre diet offered by their traditional feeding grounds in the northeast Atlantic Ocean. We can hope for change, but we shouldn’t bank on it. In the meantime we all need to be contributing to the maximum possible output of naturally generated smolts from our little river, because at the end of the day our river is a smolt factory!

In 2011 the number of fish entering the river between the 16th of February and the 31st of May was probably on a par with runs of fish in the 1960s and 1970s. A single year cannot of course tell the whole story, but what it does tell us is that in the late autumn of 2006 eggs were laid, probably by MSW fish. These spawning fish would have had a propensity to produce fish with a preference to return to the South Esk as multi sea winter spring fish. Moreover, they would have had to return in sufficient numbers to ensure recruitment of good numbers of juveniles, probably somewhere in the upper South Esk catchment. Over the two years following spawning the progeny of those fish grew to the point where in the spring of 2009 they left the river as S2 smolts and headed out to sea. After two winters at sea they returned to the South Esk in the early months of 2011.

At least something is right! For all the above to happen, quite a lot of things have to be right. If we assume that the survival rate of two sea winter fish from smolt to their return is about 5%, (but it could be better than that) then these survivors, from the abundance observed in the spring of 2011, indicate that a good number of S2 smolts left the South Esk in May/June 2008. That suggests that the habitat in certain (currently unknown) parts of the South Esk system is capable of  meeting the requirements to produce healthy smolts with the potential of becoming spring salmon.

Do spring salmon beget spring salmon? Well, maybe! An interesting additional point is that, for there to have been sufficient spawners in 2006 to produce a good output of smolts in 2009, the spring run of 2001 MSW spring salmon (in which 10 were caught at Finavon) must have had sufficient successful spawners too. While we shouldn’t assume that a spring run spawner’s progeny is necessarily comprised of only spring fish, evidence points us towards that assumption. So, although we should not make general comments on the condition of stocks and the habitats that support them from one year’s return, it is clear that some cautious extrapolation can be done. What can be said with confidence is that the South Esk continues to have the characteristics (e.g. water chemistry, temperature and gradients) required by spring salmon. But what precisely are those characteristics, and where in the catchment are they?

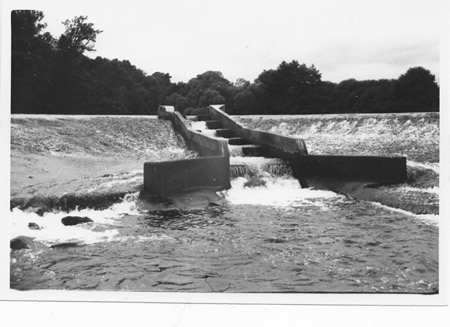
Kinnaird dyke on 14th December 1969 (below) with the River at 3″ at Finavon. A much narrower and steeper access with no ‘pool’ at the base of the pass made it very difficult for fish to use in high or cold water. Donald Macintyre, the water bailiff, remarked that the rough concrete face of the dam damaged fish and made them prone to infection.

Kinnaird Dyke 1969

Kinnaird Dyke before repairs in 1969

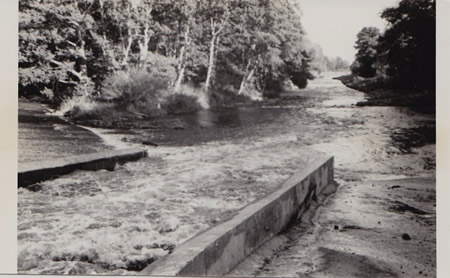
Kinnaird Dyke (below) on 29 September 1970 with the River at 1′ 4″ at Finavon. The repairs to the dyke that were done during 1970 made a big difference to enabling salmon to access the river above Brechin in the spring months. But it wasn’t until Colin Carnie in the mid nineties redesigned the dyke to reduce the flow through the pass with two wooden baffles which to this day enable salmon to swim through the pass early in the year. This is why we now see spring salmon at Finavon regularly in March month.

Kinnaird Dyke

Kinnaird Dyke after repairs in 1970

Spring 2011 salmon numbers: an educated guess? A calculation, based on the South Esk spring run of 2011 having a pre fishery abundance (PFA) of about 2,000 MSW salmon, representing 5% or more of the smolts that left the river, indicates that in 2009 the river produced up to 40,000 smolts with a preference to return as spring salmon. You may ask how I got the PFA figure of 2,000 spring fish. I can only answer that by claiming the number as a guess based on the declared Usan net catch, rod catches, the number of dead & diseased fish, and observation of fish in the pools in March, April and May. I note that no-one has yet challenged this estimated number of spring salmon.

It was clear to those who caught and released 2011 spring salmon that these survivors were in excellent condition & had fed well during their time at sea, suggesting that their marine feeding destination was probably in the productive western half of the ocean. It also begs the question, in the context of the poor grilse numbers in 2011, whether we might reasonably predict good returns of well fed MSW salmon in 2012, from grilse that elected to stay on for their second winter at sea and head west to feed. I suspect that may be a bridge too far in scientific terms, but a reasonable punt for an amateur such as myself! What it doesn’t explain is why, after a good grilse run in 2010, we had such a strong run of MSW salmon in the spring and summer of 2011. These are questions that scientists are now addressing, following the success in sampling salmon at sea done by the SALSEA project.

But what happened to the other c.95% of fish that didn’t survive? At what stage in their sea journey did they die, and from what cause?

So, while a snapshot can only be an indicator, and I certainly wouldn’t claim that it tells the whole story, a single year’s return as we had in 2011 does tell us something about the River’s ability to generate healthy populations of S2 smolts. Wouldn’t it be interesting to learn which parts of the South Esk catchment have this ability? That is why I like the Marine Scotland Science plan to track the destination of 150 spring salmon. It would be so good to learn which bits are productive, and why they are, wouldn’t it? And, just think, if we could find out where the juveniles grow well, wouldn’t we then become much more precise in our habitat improvement work?

The next blog gives the catch statistics with comments from people who have managed the river, owned beats or fished the South Esk over more than a century